Welcome to the QRS Complex Annotation Tool
Background
For my final project in the Applied Data Science course of my Data Science master’s program, I was tasked with creating an interactive web app for a data science task. I chose to develop a data labeling tool aimed at creating a hypothetical QRS boundary detection dataset. Data labeling is a crucial first step in machine learning and deep learning projects, especially when a dataset lacks a usable target variable for prediction. After labeling the waveforms in this app, users can download the labeled data and then utilize it to build a QRS-detection algorithm or model.
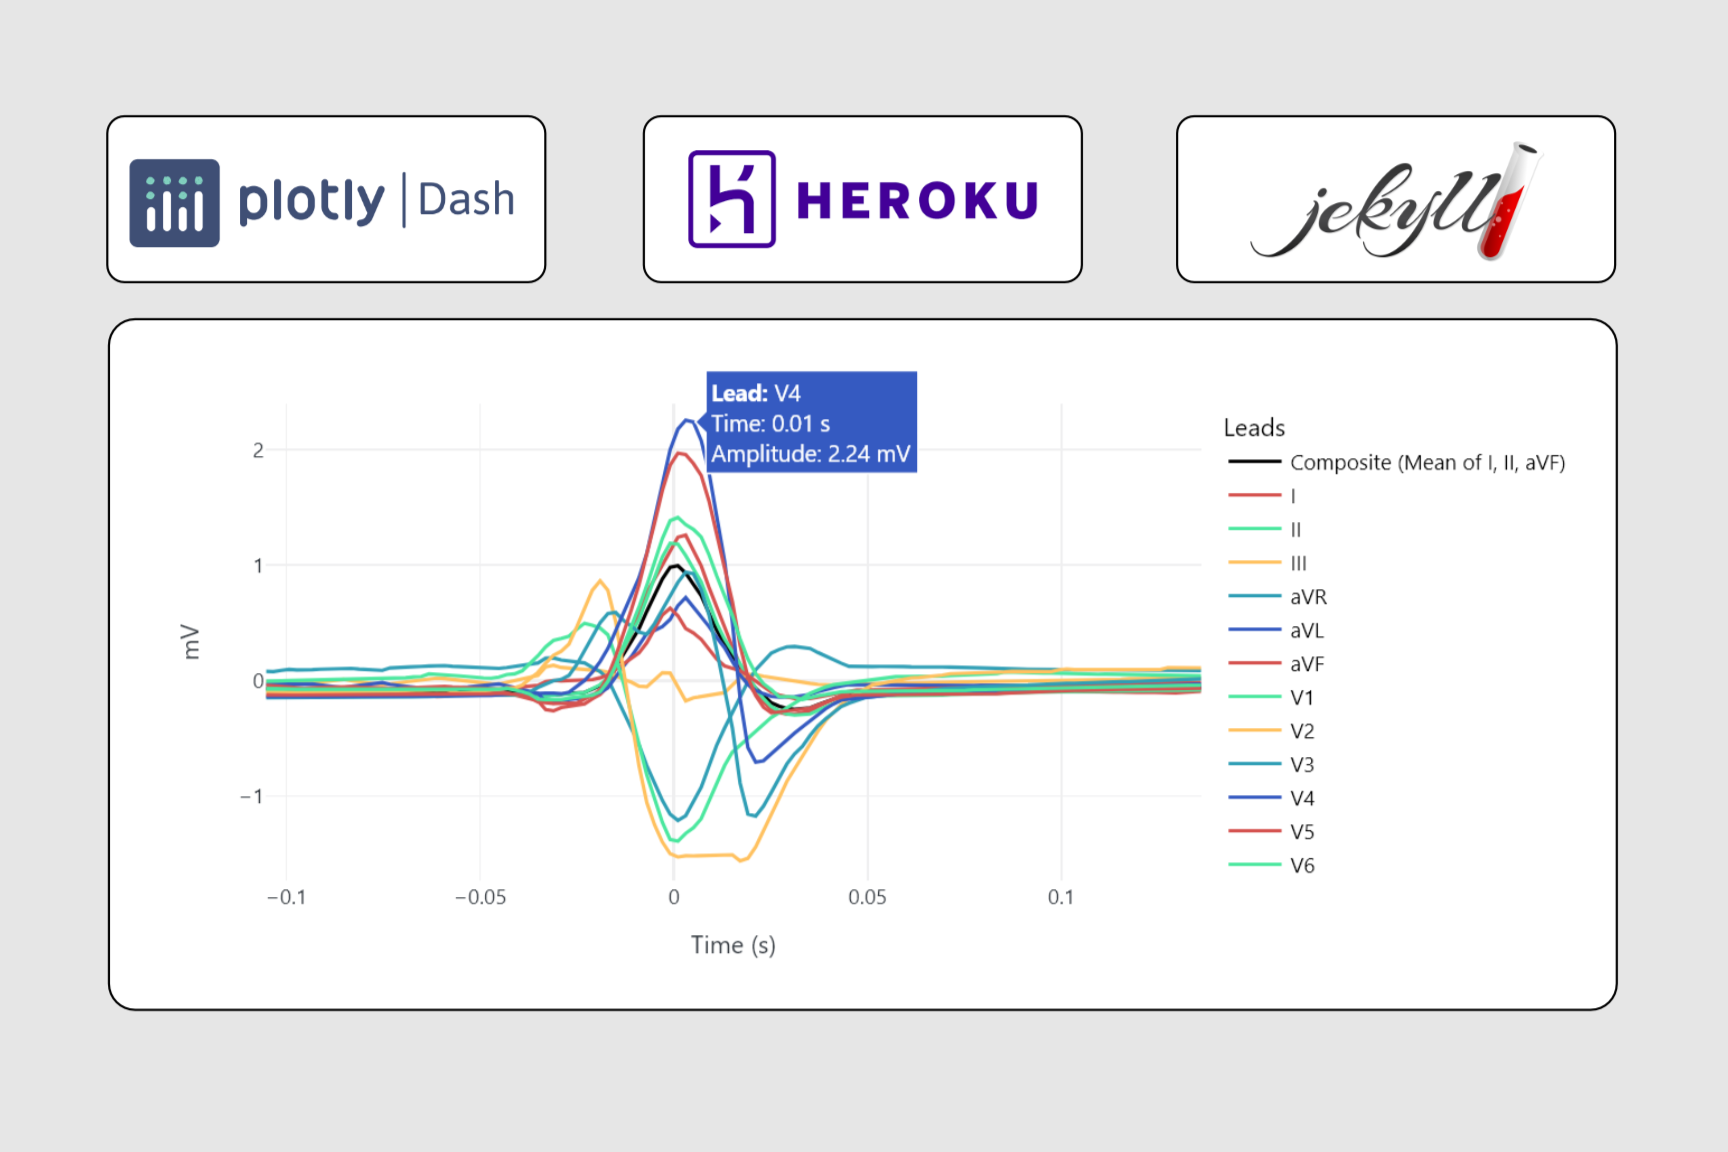
This app contains individual heartbeat ECG waveforms labeled as “normal” that I’ve preprocessed and isolated from 10-second recordings in the PTB-XL dataset. The app prompts users to specify the number of beats to annotate. For each beat, they are presented with the 12-lead ECG waveform and can annotate the Q-onset, R-peak, and S-offset boundaries by using drop-down menus and clicking the corresponding time step in the plot. After submitting each annotation, users have the ability to download the original dataset with the annotation features appended at the end of the process.
How to Use
- Select the number of beats to label, click ‘Start Labeling’.
- Read the hint, dismiss it if desired.
- Determine which leads to use by interacting with the plot, zooming, panning, etc. as needed.
- Use the QRS boundary drop-down to select a boundary.
- Click a point on a lead waveform to store that time step as the label for the selected boundary.
- When finished with the current beat, submit the annotations.
- The next beat will be shown, or a notice that you don’t have any more to label.
- Download the dataset using the ‘Download Annotations’ button.
Try It Out Below
Tip: If on mobile, rotate to landscape mode!